More+2015 HOD Model — BOSS CMASS & BGS
Model class |
|
Paper |
More et al. 2015, ApJ 806, 2 (arXiv:1407.1856, DOI:10.1088/0004-637X/806/1/2) |
Primary survey |
BOSS CMASS, \(z_\mathrm{eff} = 0.52\) |
Observable |
Joint \(w_p(r_p) + \Delta\Sigma(R)\) |
Code |
|
Cosmological framework
Both HOD models in this package share the same halo-model backbone. All quantities below feed into the HOD occupation integrals.
Cosmological parameters
The six base parameters \(\boldsymbol{\theta} = (\Omega_m,\,\Omega_b,\,h,\,n_s,\,\ln 10^{10}A_s,\,\sigma_8)\)
define the linear matter power spectrum \(P_\mathrm{lin}(k, z)\), computed by
CAMB via LinearPowerSpectrum.
Fiducial values used for BOSS CMASS benchmarks: \(\Omega_m = 0.310,\ h = 0.703,\ \sigma_8 = 0.785,\ n_s = 0.964,\ \Omega_b = 0.0451\).
Halo mass function
Tinker et al. 2008 (arXiv:0803.2706):
Implemented via make_hmf() with
backend="tinker08" (default), overdensity \(\Delta = 200\rho_m\).
Units: \(h^4\,\mathrm{Mpc}^{-3}\,M_\odot^{-1}\).
Alternative emulator backends — "csst" (Chen+2025,
SCPMA 2025)
and "aemulusnu" (Shen+2025,
arXiv:2410.00913) — expose the
same interface; see Cosmology Module for details.
Linear halo bias
Tinker et al. 2010 (arXiv:1001.3162), \(b(M, z)\). The effective galaxy bias is:
NFW profile and Fourier transform
Dark-matter halos follow the NFW profile (Navarro, Frenk & White 1997, arXiv:astro-ph/9508025):
Concentration–mass relation: Diemer & Joyce 2019
(arXiv:1809.07326),
accessed via HaloProfile with cm_relation="diemer19".
The normalised NFW Fourier transform (Cooray & Sheth 2002, Eq. 11, arXiv:astro-ph/0206508):
Galaxy number density
Mass grid: 512 log-spaced points, \(M \in [10^{10},\,10^{16}]\,h^{-1}M_\odot\).
More+2015 HOD model
Reference: More et al. 2015, ApJ 806, 2
(arXiv:1407.1856).
Implemented in MoreHODModel
(hod_mod/connection/hod/more15.py).
Incompleteness function
The BOSS CMASS sample has a colour–magnitude selection that reduces completeness at the low-mass end. More+2015 model this with a linear ramp:
Default: \(\alpha_\mathrm{inc} = 1.0\) (fixed), \(\log_{10} M_\mathrm{inc} = 13.0\) (fixed).
Central occupation
The step-function threshold \(M_\mathrm{min}\) is broadened by scatter \(\sigma_{\log M}\) (in dex, base-10). At \(M = M_\mathrm{min}\), \(\langle N_\mathrm{cen}\rangle = f_\mathrm{inc}/2\).
Satellite occupation
Satellites live in halos that first contain at least one central galaxy; their mean number rises as a power law \(\alpha\) above the threshold \(\kappa\,M_\mathrm{min}\).
Off-centering of central galaxies
A fraction \(p_\mathrm{off}\) of centrals are displaced from the halo centre (Johnston et al. 2007, arXiv:0709.4193; More+2015 §3.3). In Fourier space (mass-dependent width):
where \(r_s(M) = r_{200}(M)/c(M)\). Fixed values: \(p_\mathrm{off} = 0.34\), \(R_\mathrm{off} = 2.2\).
Power spectra
1-halo terms
Galaxy–galaxy (More+2015 Eq. 9):
Galaxy–matter (More+2015 Eq. 13):
For the satellite term, a Poisson satellite distribution gives \(\langle N_s^2\rangle = \langle N_s\rangle^2 + \langle N_s\rangle\).
2-halo terms
The beyond-linear halo bias (BNL) correction \(\delta P_\mathrm{BNL}\) follows
Mead & Verde 2021 (arXiv:2109.15266),
tabulated from the MultiDark MDR1 simulation, implemented in
BeyondLinearBiasMead21.
Total:
Summary statistics
3D correlation function
The galaxy auto-correlation function \(\xi_{gg}(r)\) and galaxy–matter cross-correlation \(\xi_{gm}(r)\) are obtained from the respective power spectra via the Ogata (2005) double-exponential \(j_0\) Hankel transform (DOI:10.2977/prims/1145474602):
Projected correlation function
More+2015 use \(\pi_\mathrm{max} = 80\,h^{-1}\,\mathrm{Mpc}\) (set via pi_max
in wp()).
Excess surface mass density
The galaxy–matter lensing signal:
Units: \(M_\odot\,h\,\mathrm{pc}^{-2}\).
Implemented in
delta_sigma().
Parameter table
Parameter |
Symbol |
Default |
Fitted? |
Prior / fixed value |
Units |
|---|---|---|---|---|---|
|
\(\log_{10} M_\mathrm{min}\) |
13.03 |
Yes |
\([11,\,15]\) |
\(\log_{10}(M_\odot h^{-1})\) |
|
\(\sigma_{\log M}\) |
0.38 |
Yes |
\([0.01,\,2]\) |
dex (base 10) |
|
\(\log_{10} M_1\) |
14.00 |
Yes |
\([11,\,16]\) |
\(\log_{10}(M_\odot h^{-1})\) |
|
\(\alpha\) |
1.0 |
Yes |
\([0.1,\,3]\) |
— |
|
\(\kappa\) |
1.0 |
Yes |
\([0.01,\,5]\) |
— |
|
\(\alpha_\mathrm{inc}\) |
1.0 |
Fixed |
1.0 |
— |
|
\(\log_{10} M_\mathrm{inc}\) |
13.0 |
Fixed |
13.0 |
\(\log_{10}(M_\odot h^{-1})\) |
|
\(p_\mathrm{off}\) |
0.34 |
Fixed |
0.34 |
— |
|
\(R_\mathrm{off}\) |
2.2 |
Fixed |
2.2 |
\(r_s\) units |
BOSS CMASS benchmarks
Three stellar-mass threshold subsamples from More+2015 Figure 3 are reproduced. Full MAP results and MCMC corner plots are in Benchmark: More+2015 — BOSS CMASS mass-threshold samples.
Data digitised from Figure 3 of More+2015 using WebPlotDigitizer;
stored in data/more2015_boss_cmass/.
Variant |
\(\log_{10} M_*^\mathrm{min}\) |
\(\chi^2\) |
dof |
\(\chi^2/\mathrm{dof}\) |
|---|---|---|---|---|
|
11.1 |
71.06 |
36 |
1.967 (pub. 0.8) |
|
11.3 |
57.60 |
35 |
1.646 (pub. 1.3) |
|
11.4 |
63.30 |
35 |
1.809 (pub. 1.5) |
|
11.1 + free \(\Omega_m,S_8\) |
35.70 |
33 |
1.082 |
Primary benchmark: logM11_12 (MAP parameters)
Parameter |
MAP |
Published (\(\pm 1\sigma\)) |
Deviation |
|---|---|---|---|
|
13.134 |
\(13.13 \pm 0.13\) |
\(+0.03\sigma\) |
|
0.458 |
\(0.469 \pm 0.13\) |
\(-0.09\sigma\) |
|
14.168 |
\(14.21 \pm 0.13\) |
\(-0.32\sigma\) |
|
1.841 |
\(1.13 \pm 0.15\) |
\(+4.74\sigma\) |
|
3.000 |
\(1.25 \pm 0.45\) |
\(+3.89\sigma\) |
Note
alpha and kappa tensions are driven by a near-degenerate likelihood valley.
MCMC medians agree much better: alpha = 1.928 (±0.19), kappa = 1.862 (+0.79/−1.03).
All mass-scale parameters agree within \(0.32\sigma\).
Variant logM11p3_12 (MAP)
Parameter |
MAP |
Published (\(\pm 1\sigma\)) |
Deviation |
|---|---|---|---|
|
13.549 |
\(13.45 \pm 0.15\) |
\(+0.66\sigma\) |
|
0.616 |
\(0.671 \pm 0.19\) |
\(-0.29\sigma\) |
|
14.548 |
\(14.51 \pm 0.17\) |
\(+0.22\sigma\) |
|
2.361 |
\(1.14 \pm 0.49\) |
\(+2.49\sigma\) |
|
0.148 |
not published |
— |
Variant logM11p4_12 (MAP)
Parameter |
MAP |
Published (\(\pm 1\sigma\)) |
Deviation |
|---|---|---|---|
|
14.166 |
\(13.68 \pm 0.16\) |
\(+3.04\sigma\) |
|
0.875 |
\(0.889 \pm 0.22\) |
\(-0.06\sigma\) |
|
14.390 |
\(14.56 \pm 0.25\) |
\(-0.68\sigma\) |
|
1.602 |
\(1.00 \pm 0.44\) |
\(+1.37\sigma\) |
|
1.675 |
not published |
— |
Free-cosmology variant logM11_12_freecosmo (MAP)
Three additional free parameters with Planck 2018 priors: \(\Omega_m = 0.310 \pm 0.020\), \(S_8 \equiv \sigma_8\sqrt{\Omega_m/0.3} = 0.798 \pm 0.044\), \(h = 0.703\) (fixed at the published value).
Parameter |
MAP |
Planck prior centre |
|---|---|---|
\(\Omega_m\) |
0.281 |
\(0.310 \pm 0.020\) |
\(S_8\) |
0.778 |
\(0.798 \pm 0.044\) |
|
13.163 |
— |
|
0.508 |
— |
|
14.224 |
— |
|
2.018 |
— |
|
2.920 |
— |
Benchmark figures (logM11_12)
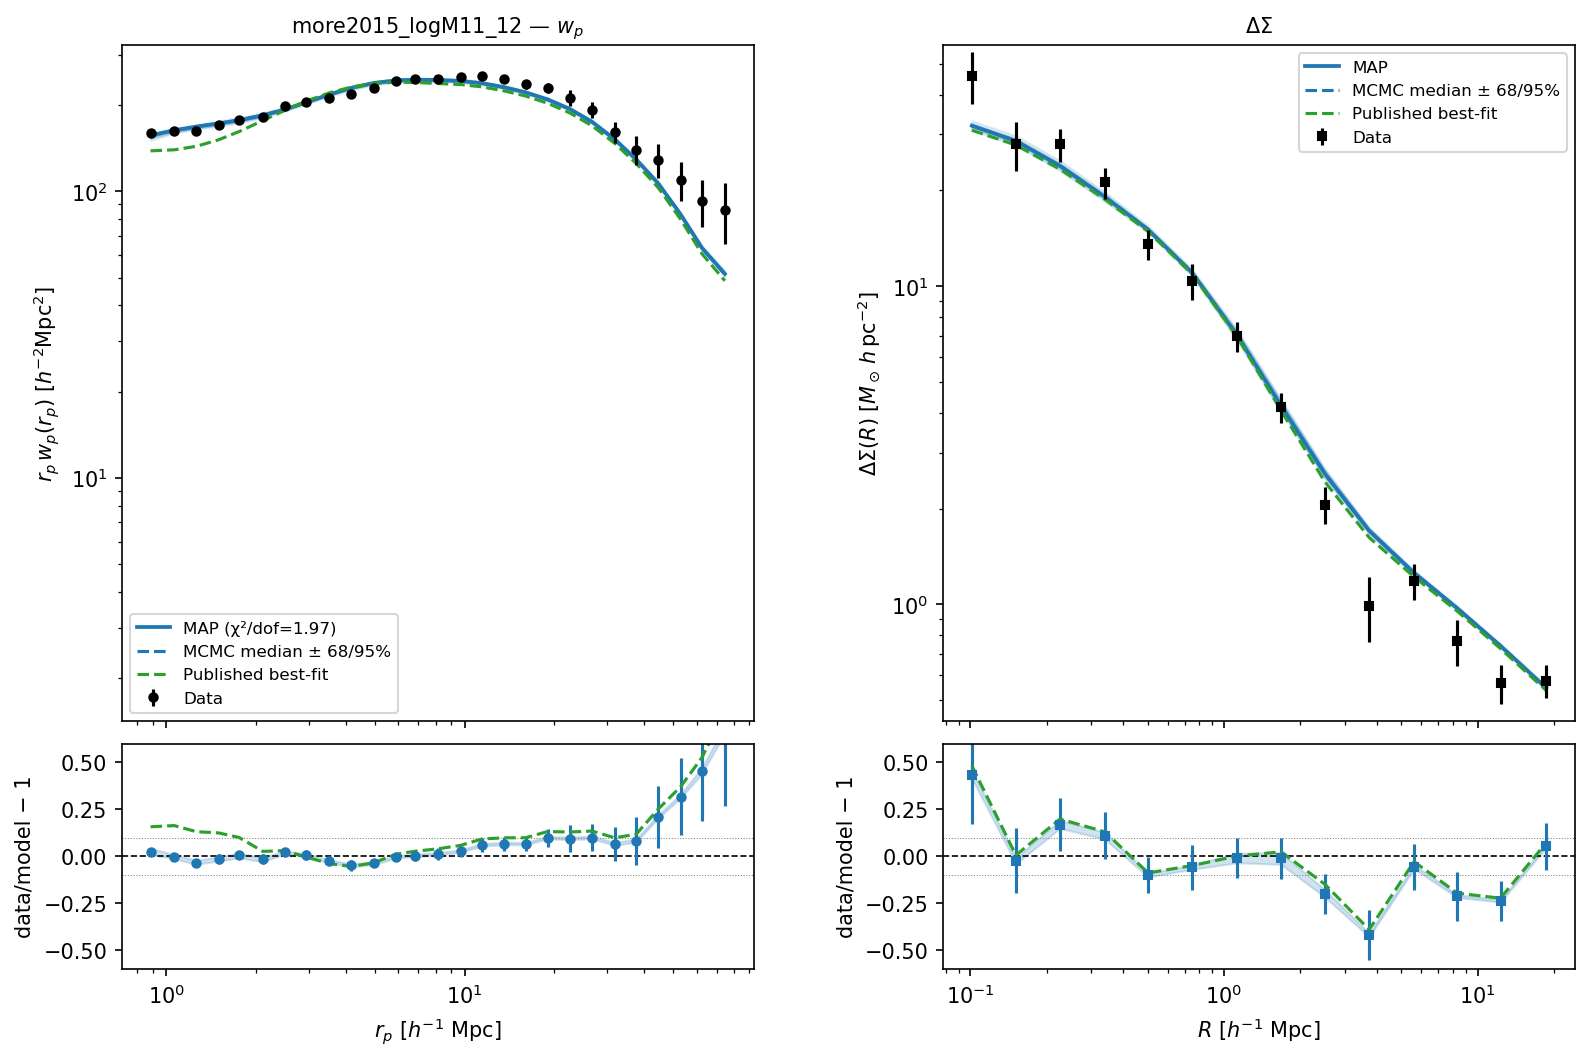
MAP fit to BOSS CMASS logM*>11.1. Top panel: \(w_p(r_p)\). Bottom panel: \(\Delta\Sigma(R)\). Orange: published More+2015 parameters. Blue: MAP. Grey: data.
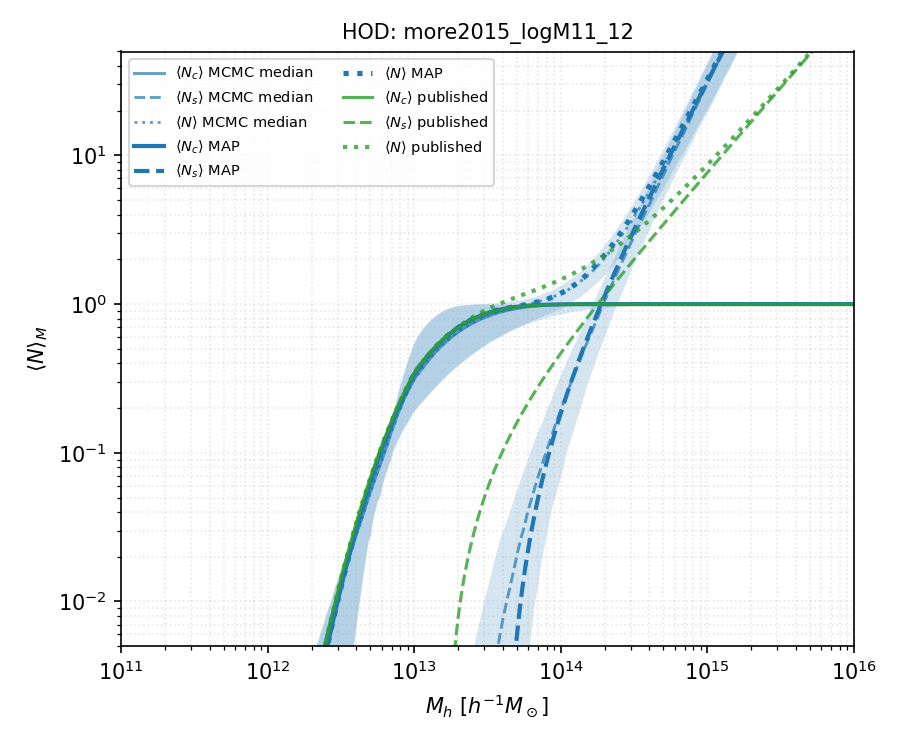
HOD occupation functions \(\langle N_c(M)\rangle\), \(\langle N_s(M)\rangle\), and \(\langle N_\mathrm{tot}(M)\rangle\). Solid: MAP. Dashed + band: MCMC median ± 1σ. Orange: published values.
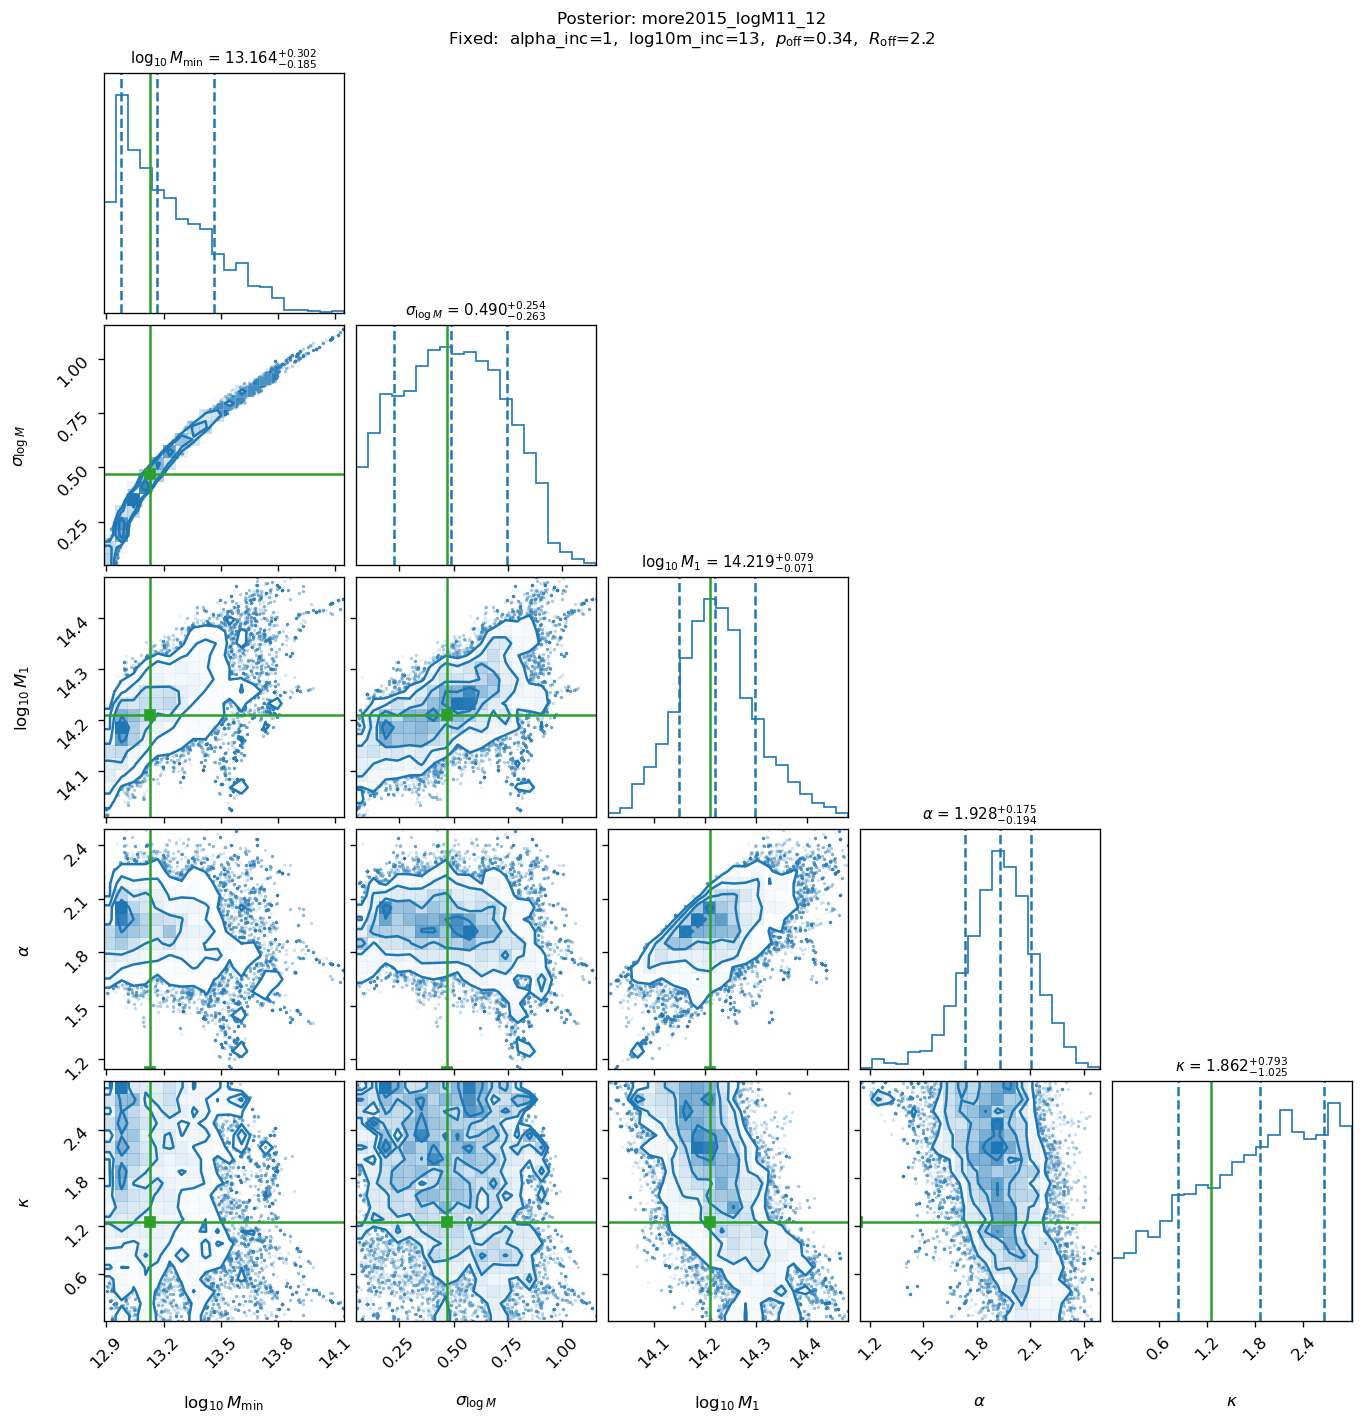
MCMC posterior corner plot (32 walkers × 2000 steps, 500 burn-in = 48 000 samples). Contours: 68% and 95% credible regions. Orange lines: published More+2015 values.
BGS LS10 — preliminary results (S4–S7)
The BGS LS10 cross-correlation \(w_\theta(\theta)\) (galaxy × eROSITA soft X-ray)
and \(w_p(r_p)\) were fitted jointly for higher stellar-mass samples
(Comparat et al. 2025, arXiv:2503.19796).
Samples S4–S7 used MoreHODModel parameters.
Sample |
\(\log_{10} M_*^\mathrm{min}\) |
\(z_\mathrm{mean}\) |
\(N_\mathrm{gal}\) |
\(\chi^2/\mathrm{dof}\) |
npts |
|
|
|---|---|---|---|---|---|---|---|
S4 |
10.75 |
0.226 |
2 802 710 |
316.60 |
31 |
12.327 |
13.358 |
S5 |
11.00 |
0.252 |
1 619 838 |
242.79 |
57 |
12.674 |
13.692 |
S6 |
11.25 |
0.255 |
541 855 |
314.32 |
31 |
13.096 |
14.132 |
S7 |
11.50 |
0.261 |
120 882 |
MAP failed |
57 |
— |
— |
Note
For S4–S6, the gas amplitude log10_A_gas converges at its lower bound (−2.0),
indicating that the gas component is not detected in these samples at current data quality.
\(\chi^2/\mathrm{dof} \gg 1\) reflects a combination of model inadequacy,
data systematics, and the gas non-detection.
These results are preliminary; see Zu & Mandelbaum 2015 iHOD Model — SDSS, X-ray & BGS for the
lower-mass samples fitted with the iHOD model.