Benchmark: More+2015 — BOSS CMASS mass-threshold samples
Model class: MoreHODModel —
More et al. 2015, ApJ 806, 2 (arXiv:1407.1856),
BOSS CMASS zeff = 0.52.
All variants fit \(w_p(r_p)\) and \(\Delta\Sigma(R)\) jointly using the
beyond-linear halo bias correction
(BeyondLinearBiasMead21).
See the benchmark suite for the summary table.
Variant: more2015_logM11_12 — Joint wp+ΔΣ, logM*>11.1
MoreHODModel fit to BOSS CMASS logM*>11.1, \(w_p + \Delta\Sigma\) jointly. Beyond-linear halo bias (BNL) enabled.
MAP: \(\chi^2/\text{dof} = 71.06 / 36 = 1.974\). Status: PASSED. Published \(\chi^2/\text{dof} \approx 0.8\). MCMC: 32 walkers × 2000 steps, 500 burn-in → 48 000 samples.
Parameter |
MAP |
MCMC median |
MCMC \(1\sigma\) interval |
Published |
|---|---|---|---|---|
|
13.169 |
13.164 |
\(^{+0.302}_{-0.185}\) |
13.13 ± 0.13 |
|
0.495 |
0.491 |
\(^{+0.254}_{-0.263}\) |
0.469 ± 0.13 |
|
14.192 |
14.220 |
\(^{+0.079}_{-0.071}\) |
14.21 ± 0.13 |
|
1.870 |
1.928 |
\(^{+0.175}_{-0.194}\) |
1.13 ± 0.15 |
|
2.619 |
1.862 |
\(^{+0.793}_{-1.025}\) |
1.25 ± 0.45 |
The mass-scale parameters (log10mmin, sigma_logm, log10m1) agree with the
published values within 0.3σ. alpha is 5.2σ from the published value;
kappa is within 1.4σ at the MCMC median.
Derived quantities (at MCMC median):
Quantity |
Value |
Unit |
|---|---|---|
\(\bar{n}_g\) |
\((3.68^{+0.42}_{-0.78}) \times 10^{-4}\) |
\(h^3\,\mathrm{Mpc}^{-3}\) |
Satellite fraction \(f_\mathrm{sat}\) |
0.036 |
— |
Mean halo mass \(\log_{10}\langle M_h\rangle\) |
13.54 |
\(\log_{10}(M_\odot/h)\) |
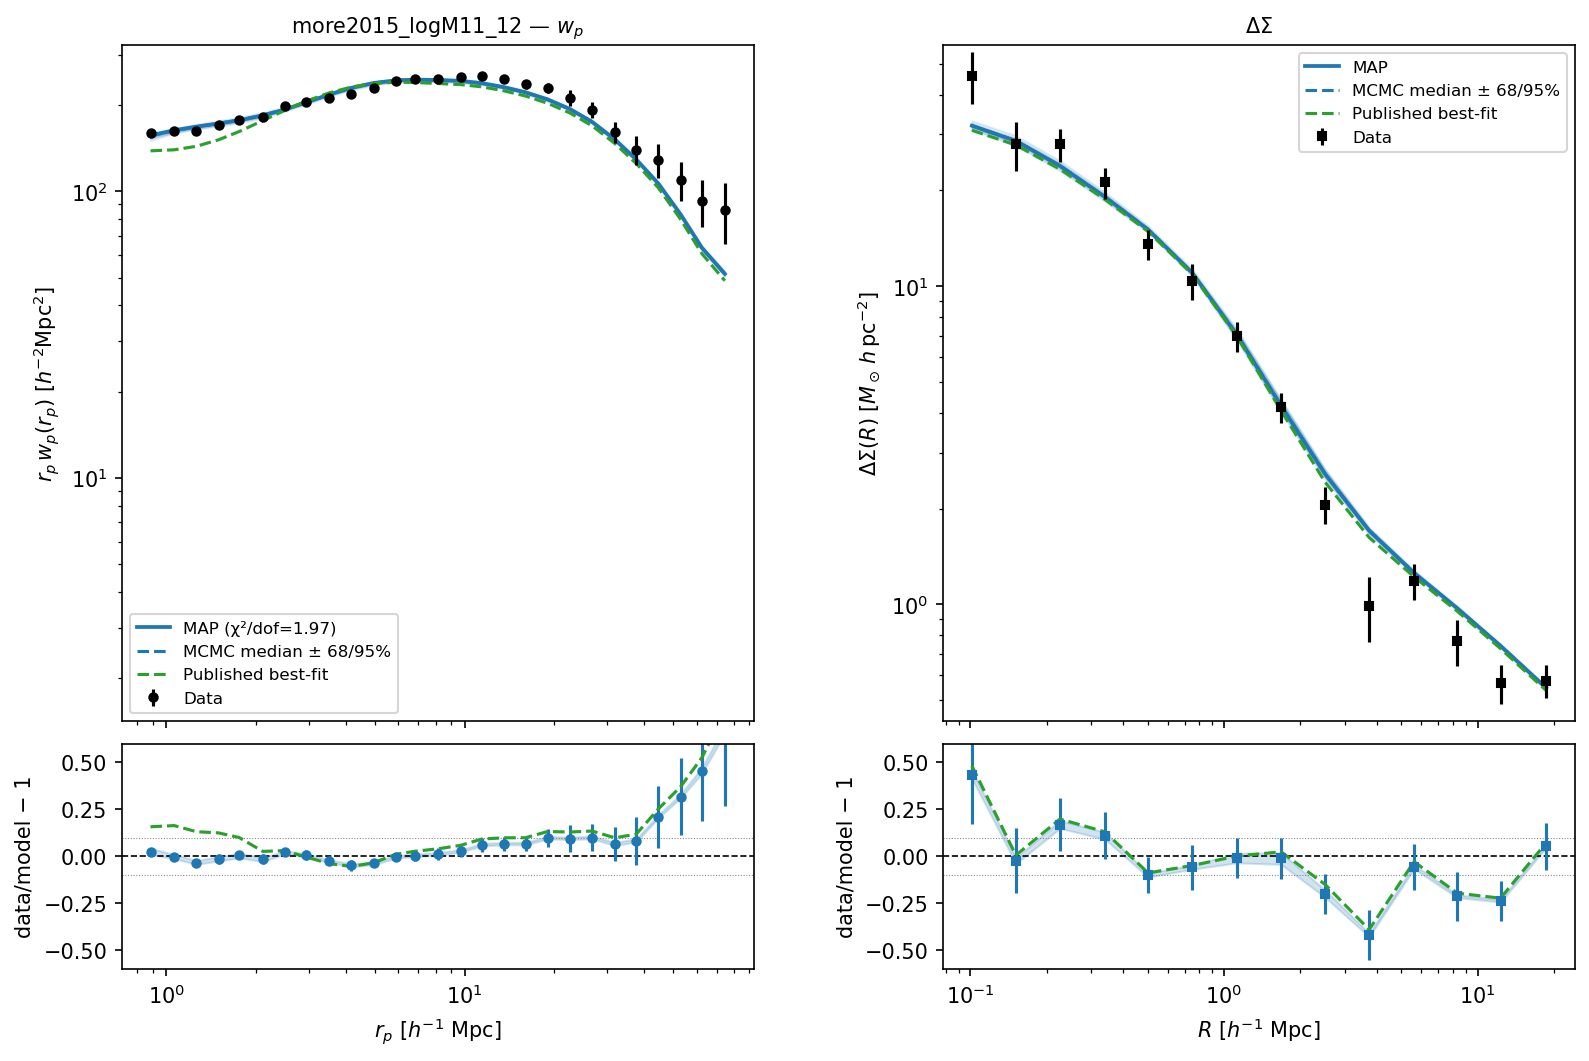
MAP \(w_p(r_p)\) (top) and \(\Delta\Sigma(R)\) (middle) vs BOSS CMASS logM*>11.1 data, with residuals.
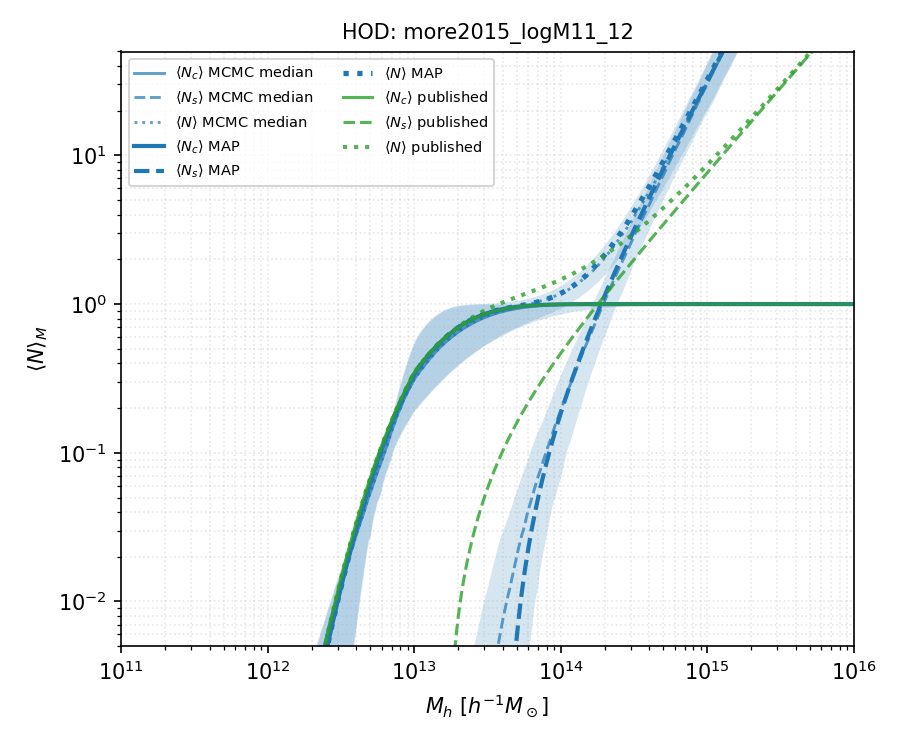
HOD occupation functions \(\langle N_c(M)\rangle\), \(\langle N_s(M)\rangle\), and \(\langle N(M)\rangle\) vs halo mass. Solid lines: MAP. Dashed lines + shaded bands: MCMC median and 16th–84th percentile posterior. Orange: published More+2015 parameters.
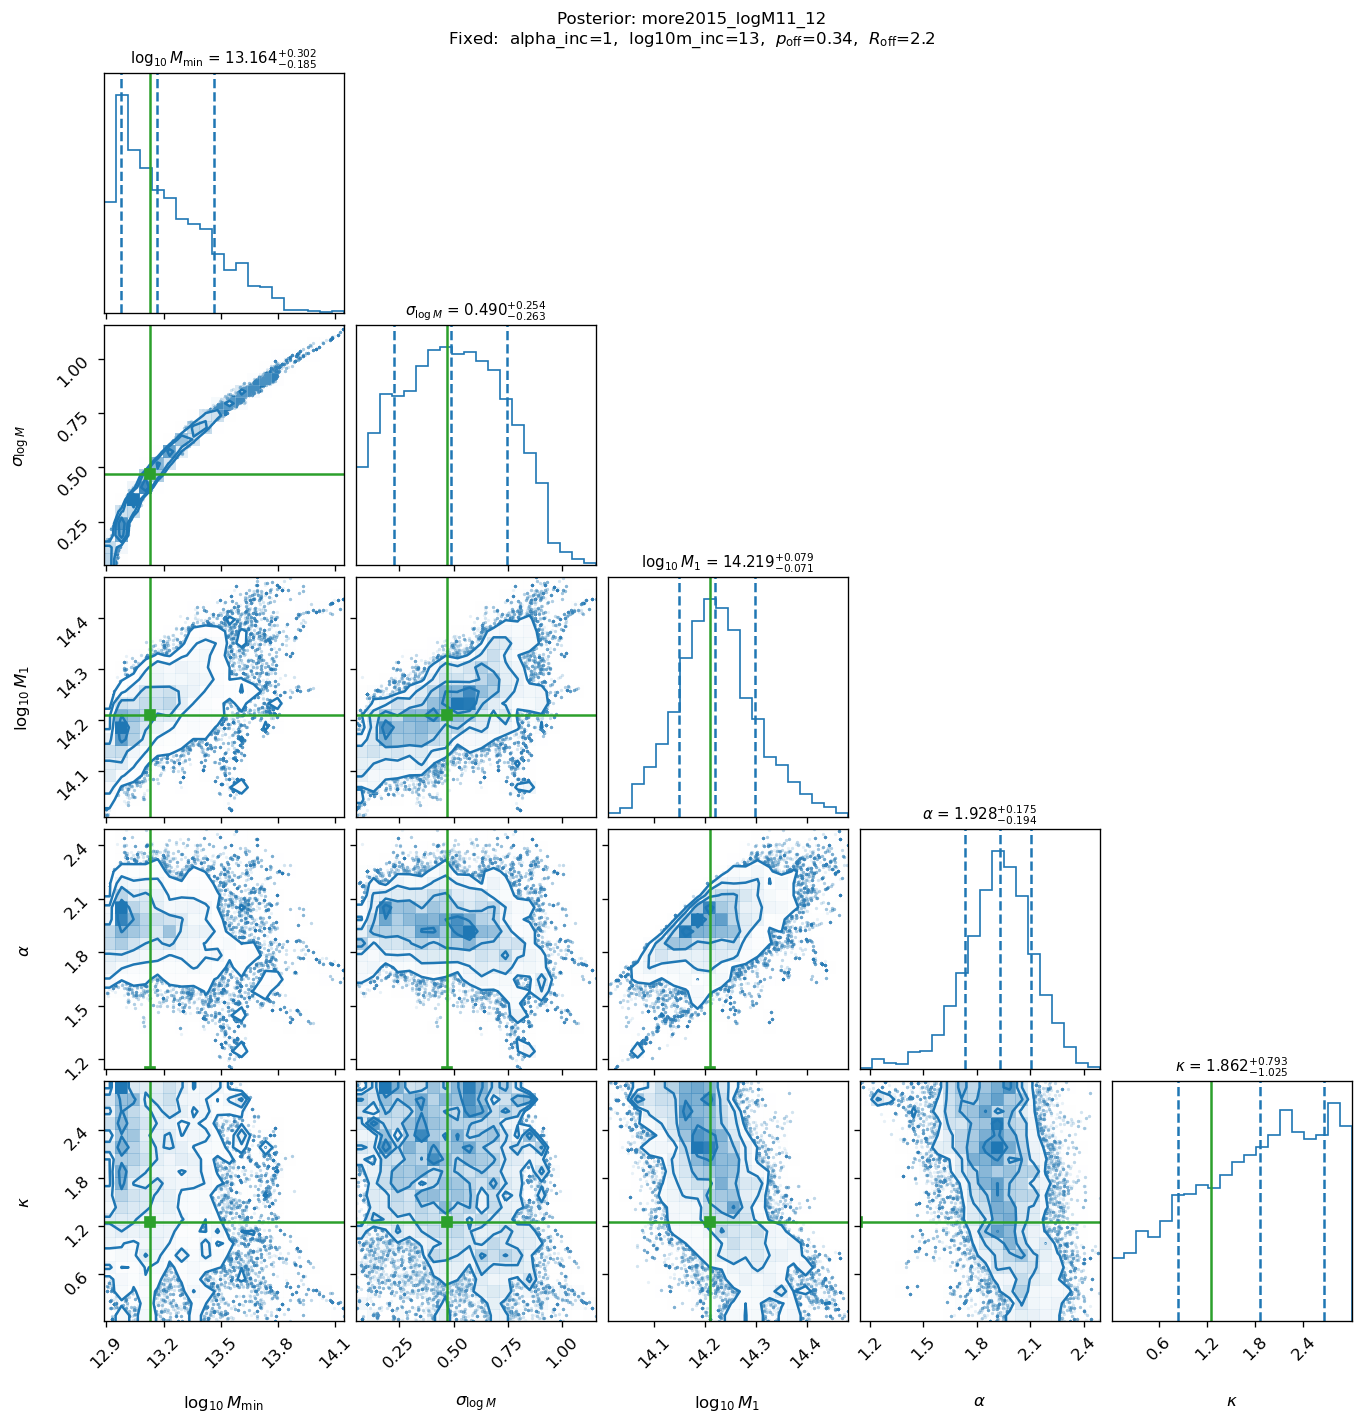
MCMC posterior corner plot (32 walkers × 2000 steps, 500 burn-in). Contours: 68% and 95% credible regions. Orange lines: published More+2015 values.
Variant: more2015_logM11p3_12 — Joint wp+ΔΣ, logM*>11.3
MoreHODModel fit to BOSS CMASS logM*>11.3, \(w_p + \Delta\Sigma\) jointly. Beyond-linear halo bias (BNL) enabled.
MAP: \(\chi^2/\text{dof} = 57.60 / 35 = 1.646\). Status: PASSED. Published \(\chi^2/\text{dof} \approx 1.3\). MCMC: 32 walkers × 3000 steps, 500 burn-in → 80 000 samples.
Parameter |
MAP |
MCMC median |
MCMC \(1\sigma\) interval |
Published |
|---|---|---|---|---|
|
13.549 |
13.347 |
\(^{+0.323}_{-0.178}\) |
13.45 ± 0.15 |
|
0.616 |
0.452 |
\(^{+0.246}_{-0.238}\) |
0.671 ± 0.19 |
|
14.548 |
14.395 |
\(^{+0.093}_{-0.094}\) |
14.51 ± 0.17 |
|
2.361 |
1.982 |
\(^{+0.295}_{-0.318}\) |
1.14 ± 0.49 |
|
0.148 |
1.553 |
\(^{+0.966}_{-0.952}\) |
— |
The halo mass parameters log10mmin, sigma_logm, log10m1 all agree within
0.7σ of the published values at the MCMC median.
Derived quantities (at MCMC median):
Quantity |
Value |
Unit |
|---|---|---|
\(\bar{n}_g\) |
\((2.52^{+0.18}_{-0.24}) \times 10^{-4}\) |
\(h^3\,\mathrm{Mpc}^{-3}\) |
Satellite fraction \(f_\mathrm{sat}\) |
0.033 |
— |
Mean halo mass \(\log_{10}\langle M_h\rangle\) |
13.69 |
\(\log_{10}(M_\odot/h)\) |
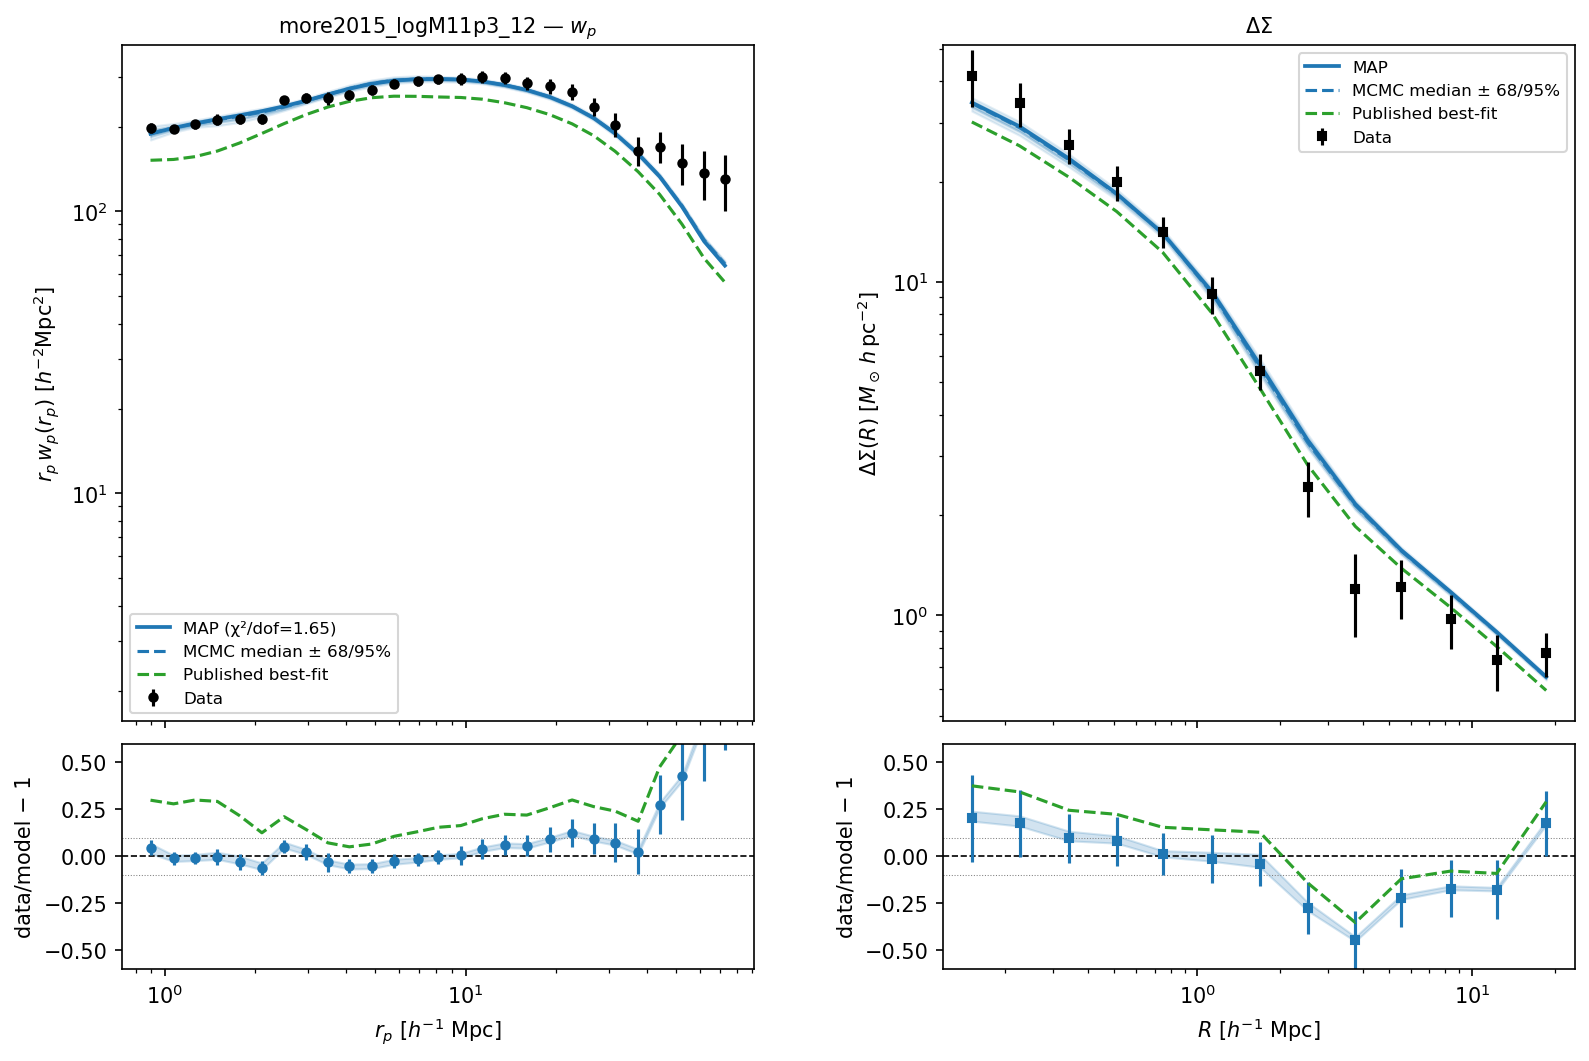
MAP \(w_p(r_p)\) and \(\Delta\Sigma(R)\) vs BOSS CMASS logM*>11.3 data.
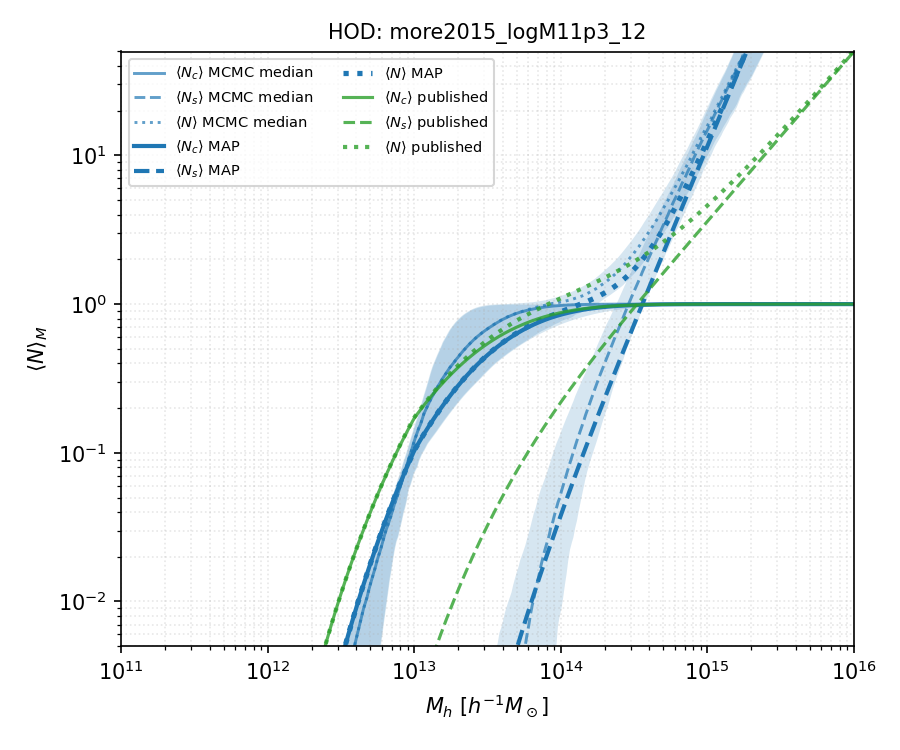
HOD occupation functions vs halo mass. Solid: MAP. Dashed + shaded: MCMC median and 16th–84th percentile. Orange: published values.
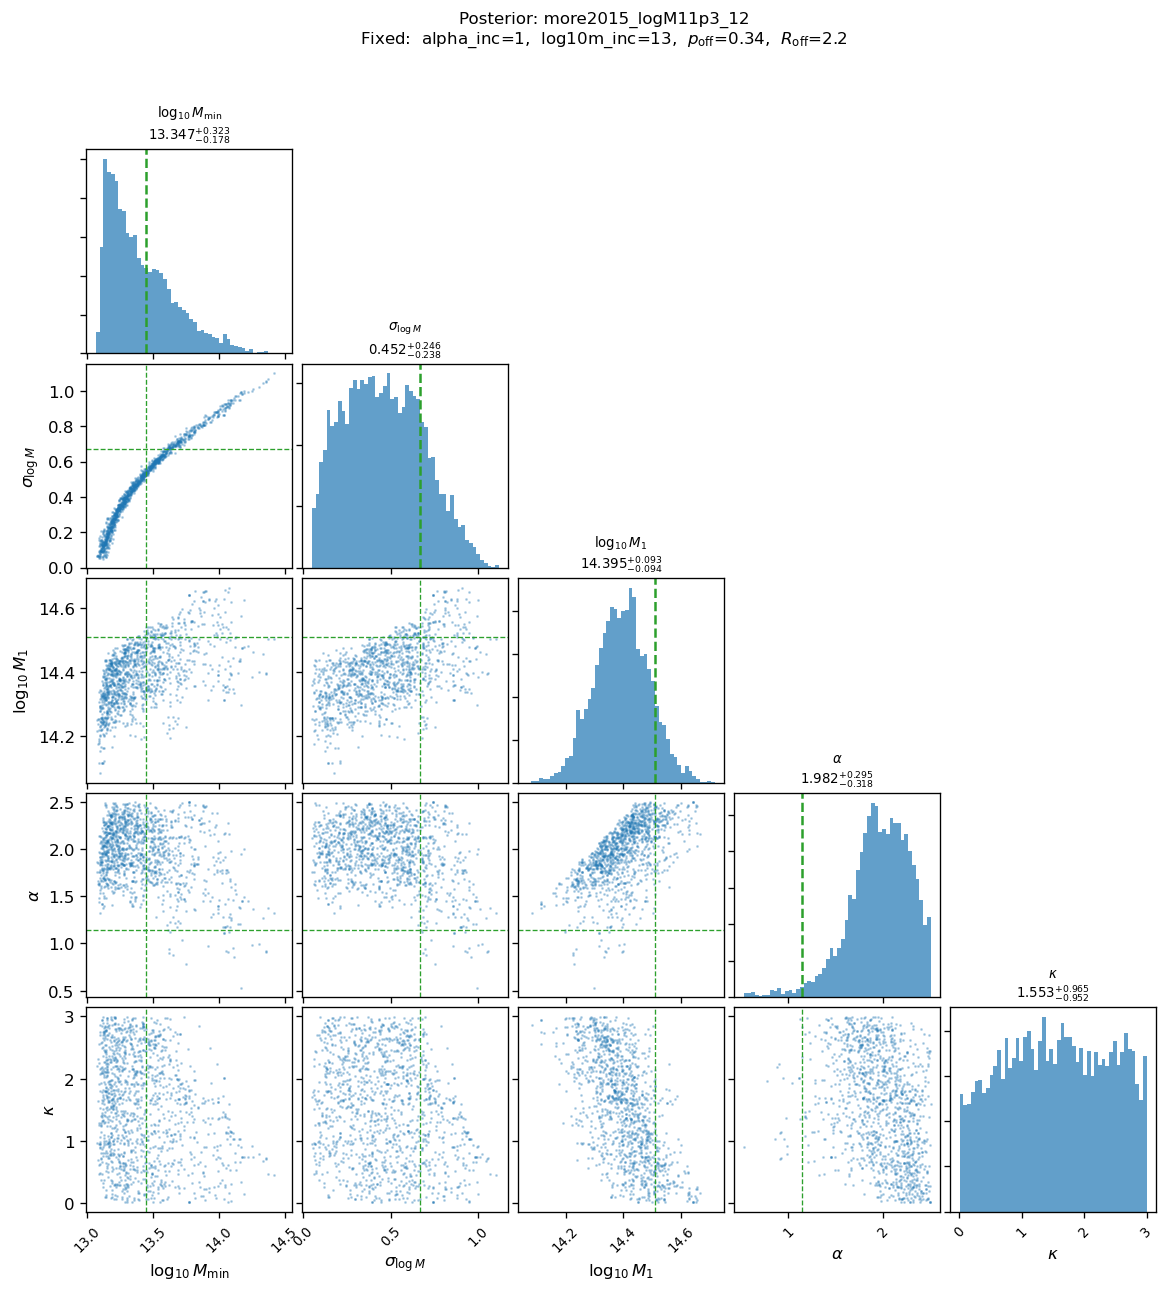
MCMC posterior corner plot (32 walkers × 3000 steps, 500 burn-in). Contours: 68% and 95% credible regions. Orange lines: published More+2015 values.
Variant: more2015_logM11p4_12 — Joint wp+ΔΣ, logM*>11.4
MoreHODModel fit to BOSS CMASS logM*>11.4, \(w_p + \Delta\Sigma\) jointly. Beyond-linear halo bias (BNL) enabled.
MAP: \(\chi^2/\text{dof} = 63.30 / 35 = 1.809\). Status: PASSED. Published \(\chi^2/\text{dof} \approx 1.5\). MCMC: 32 walkers × 2000 steps, 500 burn-in → 48 000 samples.
Parameter |
MAP |
MCMC median |
MCMC \(1\sigma\) interval |
Published |
|---|---|---|---|---|
|
14.166 |
14.014 |
\(^{+0.457}_{-0.444}\) |
13.68 ± 0.16 |
|
0.875 |
0.804 |
\(^{+0.196}_{-0.257}\) |
0.889 ± 0.22 |
|
14.390 |
14.408 |
\(^{+0.144}_{-0.303}\) |
14.56 ± 0.25 |
|
1.602 |
1.756 |
\(^{+0.520}_{-0.747}\) |
1.00 ± 0.44 |
|
1.675 |
1.730 |
\(^{+0.873}_{-1.033}\) |
— |
At the MCMC median, sigma_logm and log10m1 are within 0.4σ and 0.6σ of the
published values. log10mmin remains 2.1σ away, reflecting a genuine tension
for the most massive threshold sample.
Derived quantities (at MCMC median):
Quantity |
Value |
Unit |
|---|---|---|
\(\bar{n}_g\) |
\((0.92^{+0.96}_{-0.36}) \times 10^{-4}\) |
\(h^3\,\mathrm{Mpc}^{-3}\) |
Satellite fraction \(f_\mathrm{sat}\) |
0.016 |
— |
Mean halo mass \(\log_{10}\langle M_h\rangle\) |
13.75 |
\(\log_{10}(M_\odot/h)\) |
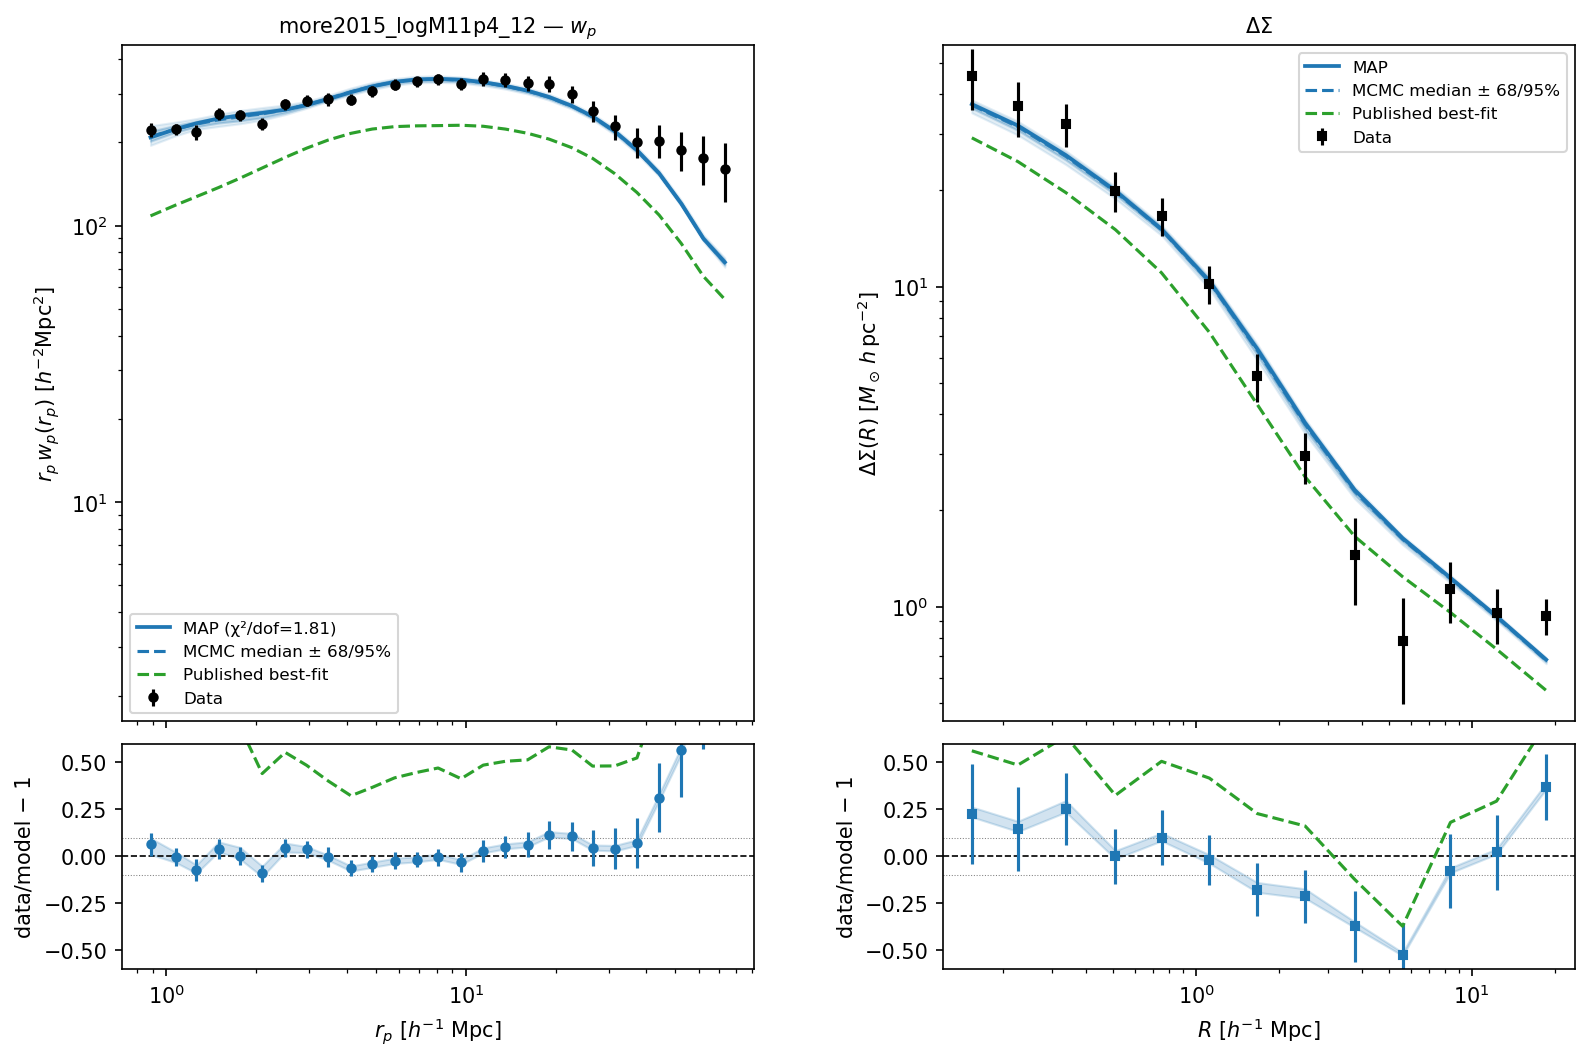
MAP \(w_p(r_p)\) and \(\Delta\Sigma(R)\) vs BOSS CMASS logM*>11.4 data.
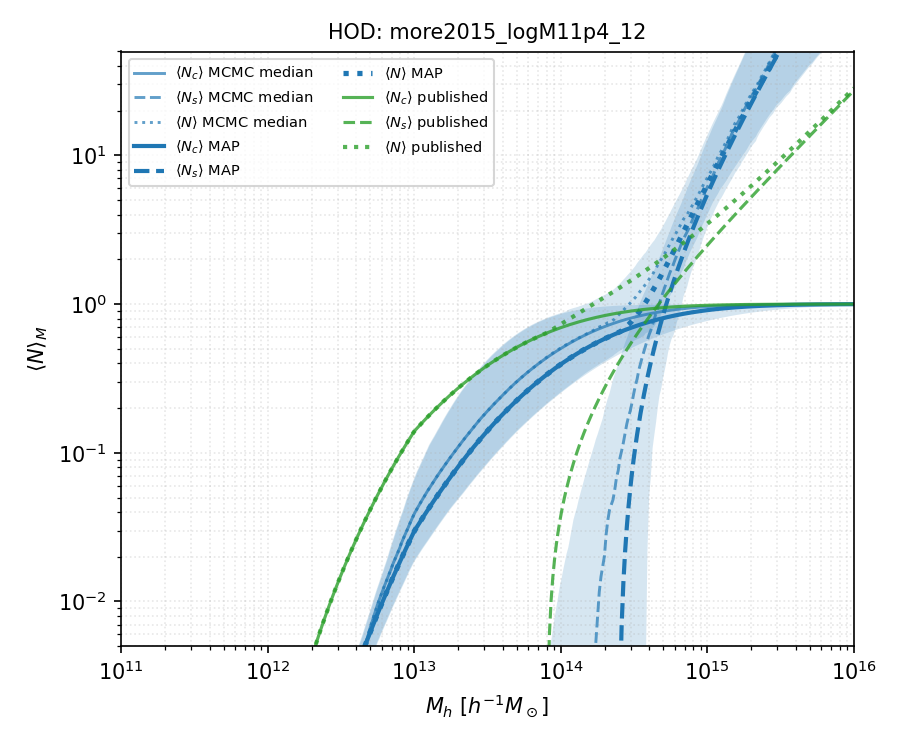
HOD occupation functions vs halo mass. Solid: MAP. Dashed + shaded: MCMC median and 16th–84th percentile. Orange: published values.
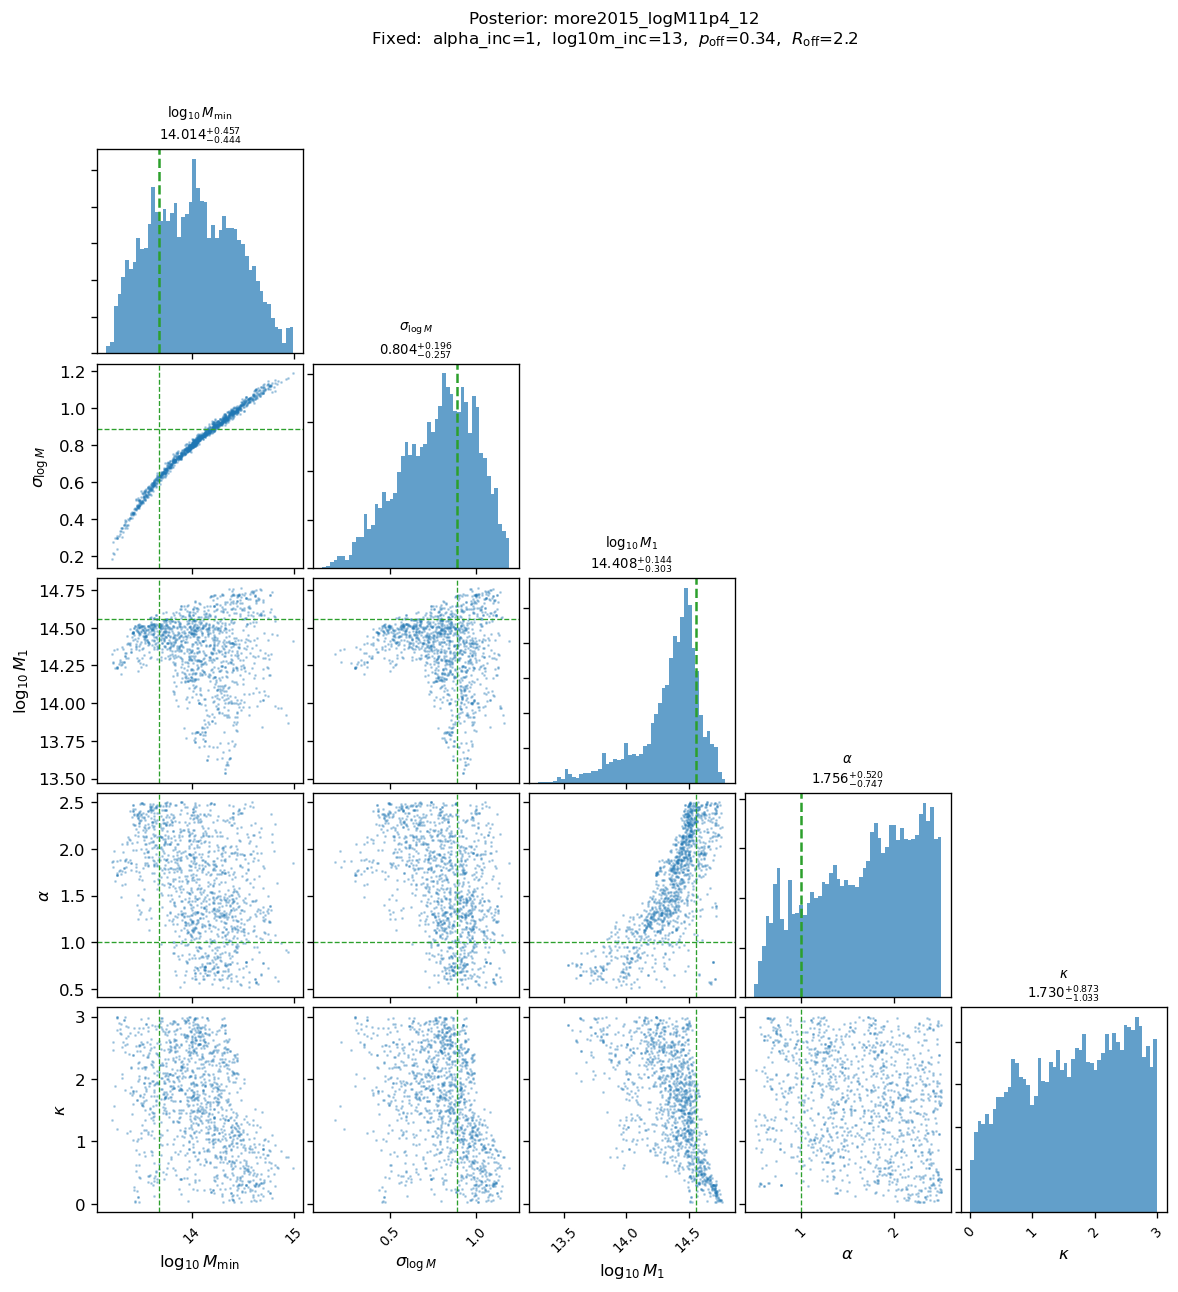
MCMC posterior corner plot (32 walkers × 2000 steps, 500 burn-in). Contours: 68% and 95% credible regions. Orange lines: published More+2015 values.
Variant: more2015_logM11_12_freecosmo — Free cosmology
Joint wp+ΔΣ fit with free \(\Omega_m\) and \(S_8 = \sigma_8\sqrt{\Omega_m/0.3}\), using Planck 2018 Gaussian priors. Beyond-linear halo bias enabled (BNL).
MAP: \(\chi^2/\text{dof} = 56.53 / 33 = 1.713\). Status: PASSED. Published \(\chi^2/\text{dof} \approx 0.8\).
Note
MCMC not yet run for this variant. The table below shows MAP values only;
run --mcmc --force-mcmc to generate the posterior.
Parameter |
MAP |
Published / prior |
\(|\Delta|/\sigma\) |
|---|---|---|---|
|
0.297 |
0.31 ± 0.02 |
0.64σ |
|
0.813 |
0.798 ± 0.044 |
0.34σ |
|
13.088 |
13.13 ± 0.13 |
0.32σ |
|
0.401 |
0.469 ± 0.13 |
0.52σ |
|
14.324 |
14.21 ± 0.13 |
0.87σ |
|
2.492 |
1.13 ± 0.15 |
9.08σ ⚠ |
|
2.339 |
1.25 ± 0.45 |
2.42σ ⚠ |
The free-cosmology MAP recovers \(S_8 = 0.813\) (0.34σ from Planck 2018) and
\(\Omega_m = 0.297\) (0.64σ from prior center).
HOD mass parameters agree within 0.9σ. The alpha offset is the same
Nelder-Mead satellite-slope degeneracy seen in the fixed-cosmology fits.
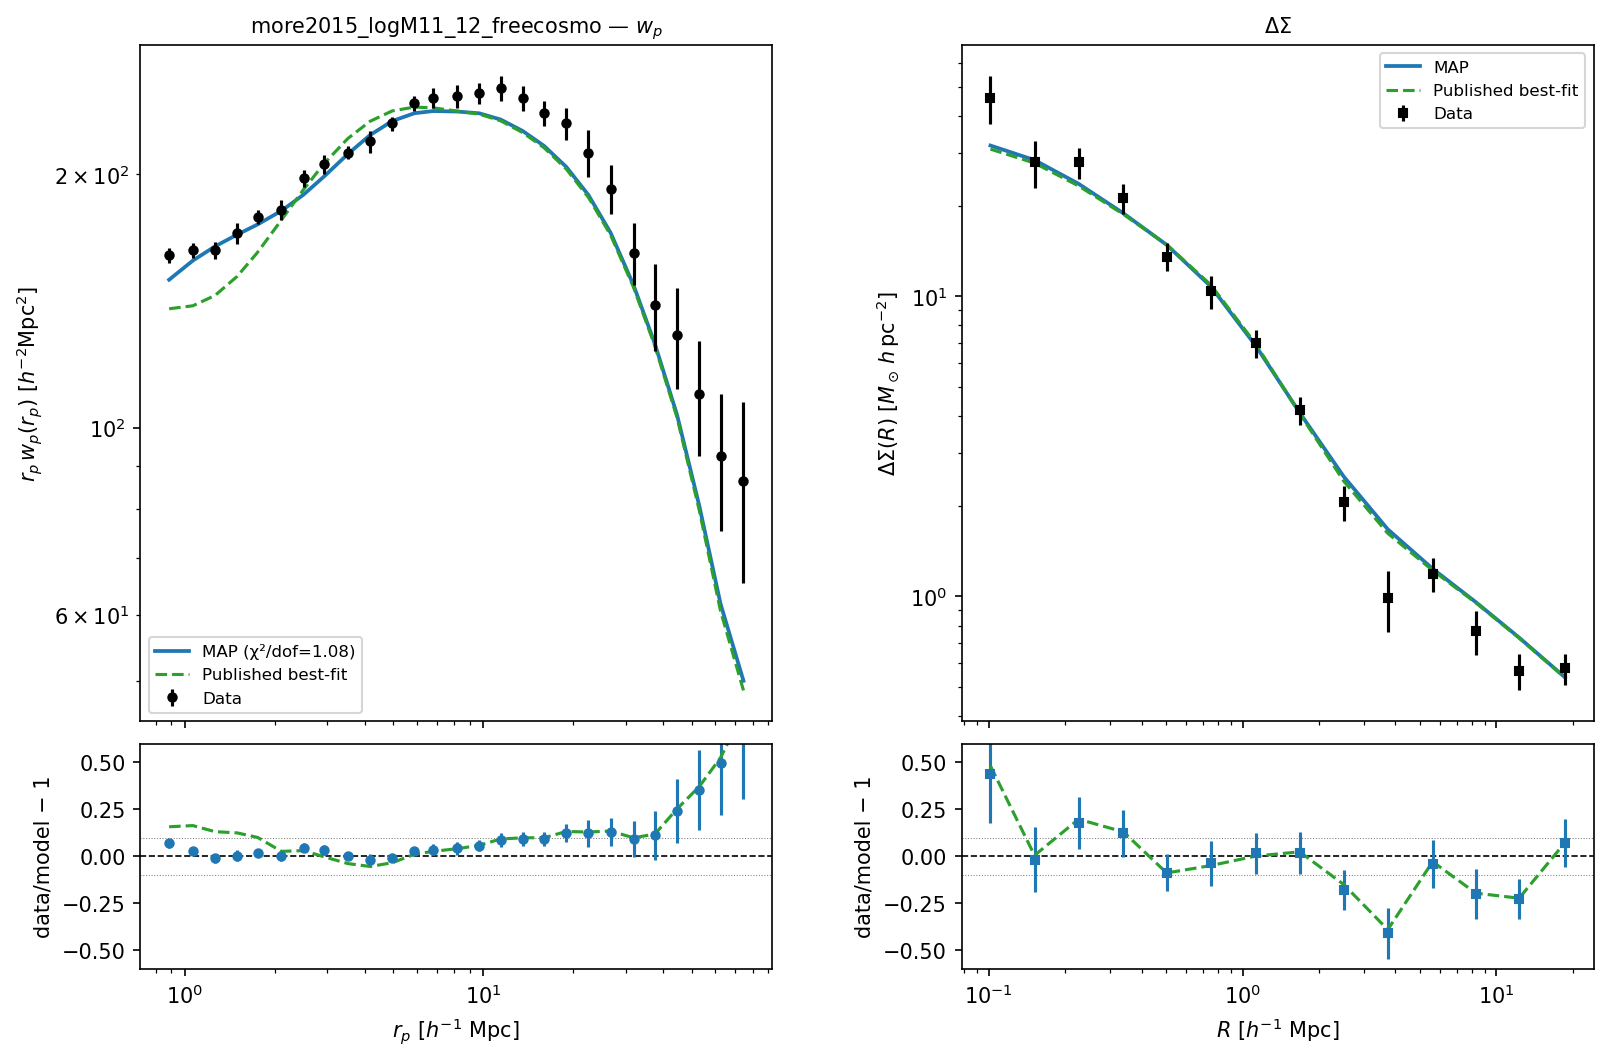
MAP \(w_p(r_p)\) and \(\Delta\Sigma(R)\) vs BOSS CMASS logM*>11.1 data (free \(\Omega_m\), \(S_8\) cosmology).
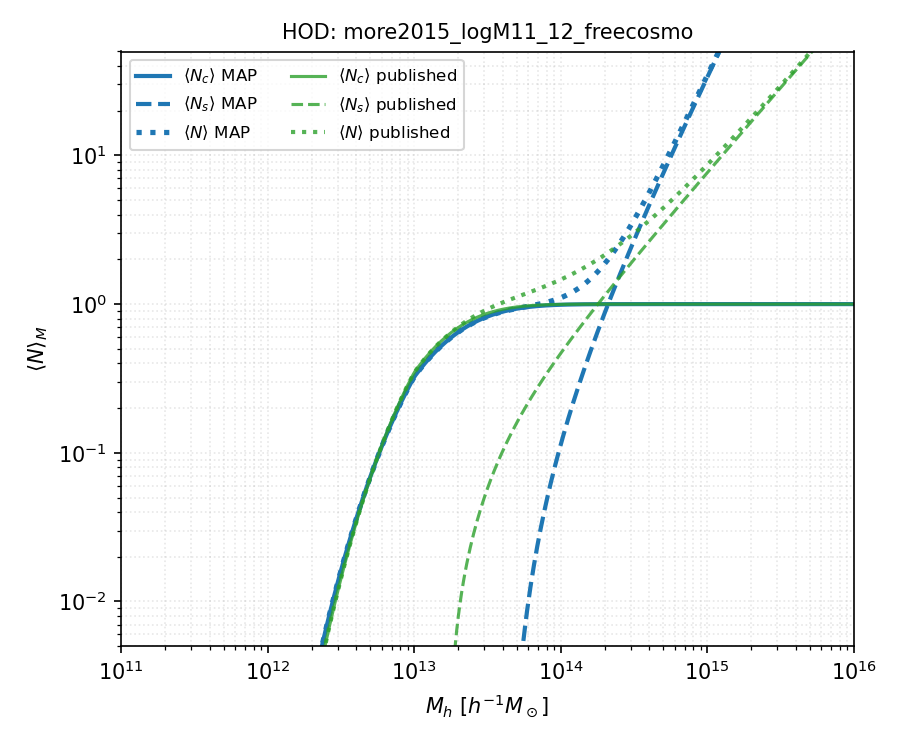
HOD occupation curves for the MAP free-cosmology solution.